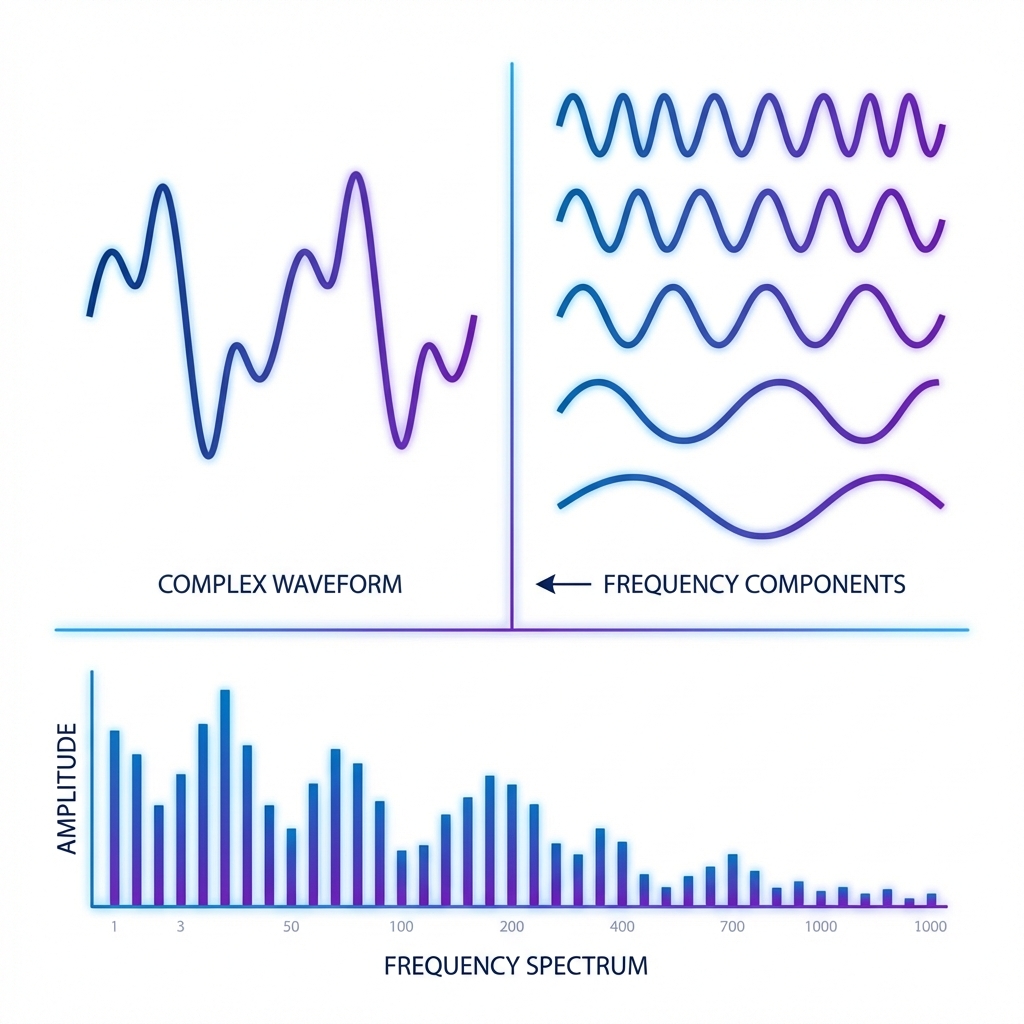
The Fourier Transform answers a simple question: what frequencies make up this signal?
If a waveform looks messy in the time domain, Fourier shows the clean building blocks underneath—sines and cosines. That is why it powers audio, images, compression, and many ML features.
This guide is practical and clear. We build intuition, show the formulas you actually use, and end with engineering tips like sampling and windowing.
A time‑domain signal is just amplitude over time. The frequency domain shows how much of each frequency is present.
Think of a chord on a piano. In time, it is one waveform. In frequency, it is a few clear notes.
Any reasonable signal can be built from sine waves. Each sine has a frequency, amplitude, and phase.
Fourier analysis finds those sines for you.
Complex exponentials are just a compact way to describe sine and cosine together.
e^(iθ) = cos(θ) + i sin(θ)Using complex numbers keeps formulas clean and makes fast algorithms possible.
For a continuous signal x(t), the Fourier Transform projects the signal onto every frequency.
X(f) = ∫ x(t) e^(−i 2π f t) dtThe result X(f) tells you the amplitude and phase at frequency f.
Real data is sampled. The DFT takes N samples and returns N frequency bins.
X[k] = Σ_{n=0}^{N-1} x[n] * e^(−i 2π k n / N)Each bin k corresponds to a frequency in the sampled signal.
The Fast Fourier Transform computes the same result as the DFT, but reuses work by splitting the signal into even and odd parts.
DFT is O(N^2). FFT is O(N log N). That speedup enables real‑time audio and image processing.
Sampling too slowly causes aliasing: high frequencies appear as lower ones.
Nyquist rate = 2 × max frequency
Use anti‑alias filters before sampling
A finite time window creates artifacts in frequency. Window functions smooth the edges so energy does not leak across bins.
Hann and Hamming are good defaults. Pick a window based on your resolution vs leakage trade‑off.
Convolution in time equals multiplication in frequency. This is why FFTs are used for fast filtering.
FFT(x * h) = FFT(x) · FFT(h)Signals change over time. The short‑time Fourier transform computes the spectrum in small windows, creating a time‑frequency view called a spectrogram.
Normalize input amplitude before FFT
Use power‑of‑two sizes for speed
Pick a window that matches your use case
Interpret magnitude and phase together
Try it
What does the Fourier Transform produce?
Order the steps for computing a simple spectrogram.
Drag and drop practice coming soon! For now, here are the items to match:
What is the Nyquist rate?
The Fourier Transform turns signals into frequencies. Once you understand that shift in perspective, many tools in audio, vision, and ML make more sense.
Master the basics—sampling, windowing, and the FFT—and you can confidently analyze and shape real‑world signals.
